Roanoke Valley Drought Dashboard
How do Roanoke’s current rainfall and water levels measure up to the region’s worst drought? Check rainfall totals and water levels at Smith Mountain Lake and Carvins Cove compared to the peak of the 2001–2003 drought.
Where we stand today: 2026 precipitation
A snapshot from the National Weather Service Roanoke climate report. The gauge shows this year's rainfall as a share of normal for the year so far.
Roanoke rainfall calendar
Daily precipitation recorded at Roanoke-Blacksburg Regional Airport (KROA). Pick an available month and year to see the day-by-day breakdown and how the month stacks up against normal. Available years: 2001–2003 and 2025–2026. Tap any day for details.
Most days come from NOAA NCEI's quality-controlled daily summaries. Because NCEI quality-controls each day (a 3–4 day lag), the most recent days are filled in from live NWS observations at KROA and marked preliminary until the official NCEI value arrives.
Virginia drought map, this week
U.S. Drought Monitor status for Virginia for the week of July 14, 2026. Categories range from D0 (abnormally dry) to D4 (exceptional drought). The Drought Monitor is issued once a week, every Thursday morning, based on conditions through the preceding Tuesday.
Smith Mountain Lake
Fed by the Roanoke River, Smith Mountain Lake is operated by Appalachian Power. Its annual high and low elevations echo the same dry spell — and today's live reading sits below the normal operating band.
5.6 ft below full pond
currently below the normal band
full pond 613.0 ft
low 1970 · high 1978
Carvins Cove Reservoir
Carvins Cove is the Roanoke Valley's largest reservoir, operated by the Western Virginia Water Authority. The gauge shows where today's level sits between the 2002 drought low and full pond (1,170 feet above sea level).
15.3 ft below · July 19, 2026
34.1 ft below · Oct 8, 2002
1.2 ft below · Aug 6, 2025
Timeline of the 2001–2003 Drought
The numbers above in motion: how a multi-year La Niña dry spell gripped the state, and how a sudden El Niño shift broke the cycle. Click any point to explore.
The rainfall gap: how far behind "normal" we fell
Each point shows how many inches of rain Roanoke was ahead of (above zero) or behind (below zero) a normal year, added up week by week from January 2001 through December 2003.
When did the decline begin? Monthly rainfall explorer
Pick any year from 1998–2026 to see its month-by-month rainfall against the long-run monthly normal. The default — 2001 — shows the decline in action: almost every month came in below normal.
The slide and the rebound, month by month
Monthly departure from normal (inches above/below) for 2000–2003. Watch the bars sink below zero through 2001 and into 2002, then swing positive as 2003's rains arrive.
Annual rainfall vs. the long-term average
Roanoke's total precipitation each year (1995–2010), with the ~41" normal shown as a line.
Virginia drought severity, then and now
Share of Virginia in severe or worse (D2+), extreme or worse (D3+), and exceptional (D4) drought, week by week — clipped to Virginia from the U.S. Drought Monitor. Left: the 2001–2003 drought. Right: the 2025–2026 current period (no USDM files for 2004–2024).
2001–2003 drought
2025–2026 current
Virginia at peak drought
What would it take to recover from a drought today?
Recovery isn't just about total rainfall — it depends on runoff, soil moisture, water demand, evaporation, and the timing of storms. But as a rough, meteorology-only guide: how many months of above-normal rain would it take to erase a given rainfall deficit? Drag the sliders and watch the tank.
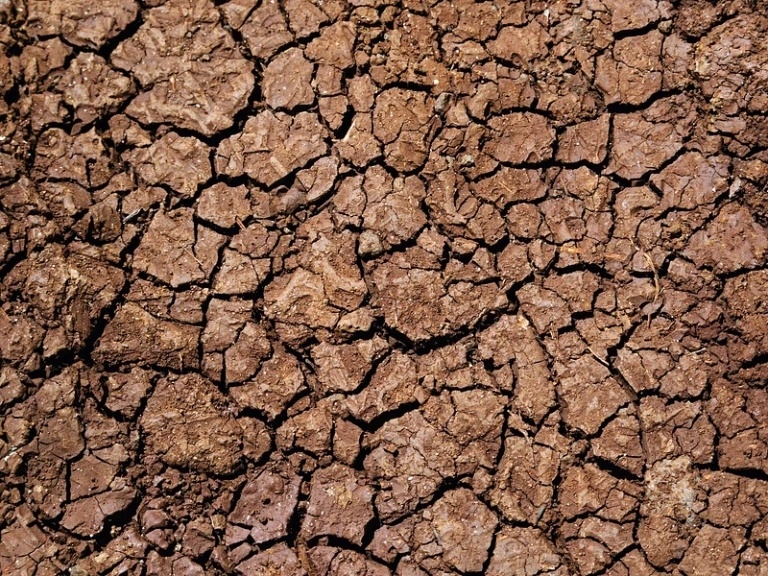

Cracked earth represents today's drought. Drag Extra rainfall per month to watch green grass return and rain intensify as recovery builds.